Making research a joy, not a chore
A sandbox that turns data work into a repeatable loop — choose sources, explore, dashboard. Mix World Bank, OECD, Google Earth Engine, all together instantly. No Python or front-end expertise required: just a good research question.
The loop in action
The problem
You start with a research question.
Then spend weeks hunting for the right data sources.
World Bank data in one place,. Google Earth in another. Survey data on a hard drive somewhere.
You wrangle it all in a notebook you'll never open again.
The stats in RStudio you learned in grad school? Dusty, outdated. The ecosystem moved on.
You finally get to visualization — and Python's GUI tooling can't hold a candle to what a modern React/Vue dashboard can do.
So you screenshot charts. Paste them into slides.
Months of work. A static PDF. No one can reproduce it.
From raw question to interactive dashboard — in a single flow
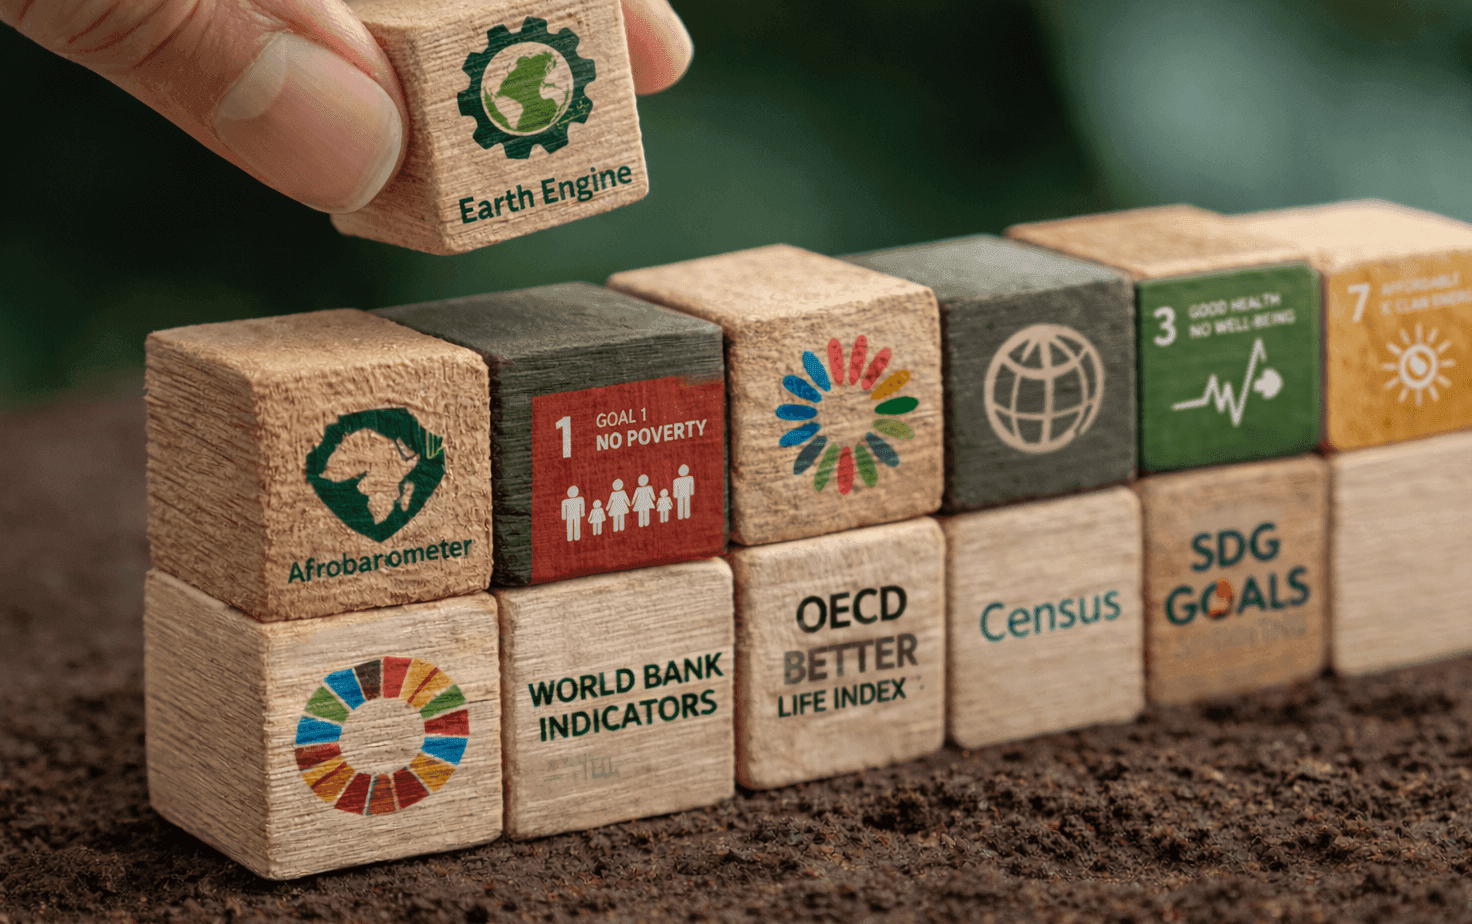
Choose your adventure: sources that match your questions
Every source has a Python class in analysis/sources/. Each one downloads to raw-data/ and exports to dashboard-data/. The dashboard doesn't care where the data came from.
World Values Survey
Cultural values, social attitudes, beliefs across 100+ countries
Pew Research
Global attitudes, religion, politics, tech adoption surveys
Afrobarometer
Democracy, governance, economic conditions across 30+ African countries
Arab Barometer
Public opinion across MENA — governance, economy, social values
World Bank WDI
GDP, Gini, poverty, education — 1,400+ indicators by country-year
World Bank SPI
Statistical Performance Indicators — data quality scores by country
World Bank API Discovery
Indicators, data catalog, projects, finances, climate endpoints
Worldwide Governance Indicators
Rule of law, control of corruption, government effectiveness by country
WJP Rule of Law Index
Constraints on government, open government, fundamental rights scores
SDG Index
Sustainable Development Goal progress scores by country and goal
Corruption Perceptions Index
Transparency International CPI — perceived public sector corruption scores
UNDP Human Development Report
HDI, gender inequality, multidimensional poverty indices by country
RSF Press Freedom Index
Reporters Without Borders press freedom scores and rankings
ND-GAIN Country Index
Climate change vulnerability and readiness scores by country-year
Fragile States Index
State fragility scores across 12 social, economic, political indicators
UN E-Government Index
Digital public services and online participation scores by country
Global Peace Index
Societal safety, militarization, conflict scores across 163 countries
V-Dem
Varieties of Democracy — 500+ democracy indicators back to 1789
IMF CDIS
Coordinated Direct Investment Survey — bilateral FDI positions by country
IATI
International aid transparency data — activities, transactions, results
OECD DAC
Official development assistance flows by donor, recipient, and sector
OECD Better Life Index
Quality of life, housing, health, work-life balance across OECD nations
US Census + ACS
Demographic, economic, housing data at national/state/tract granularity
CDC BRFSS
Annual US health behavior microdata — smoking, exercise, chronic conditions
BLS ATUS
American time-use microdata (2003-2024) + pre-aggregated TU time series
Countries + Continents
Canonical ISO 3166 + UN M49 country-code / continent mapping table
Our World in Data
Chart catalog + time series across health, energy, environment, and more
Foursquare Open Places
Global POI dataset — 100M+ places with categories, coordinates, addresses
GUPPD
Urban polygon boundaries + settlement points with population data 1975–2030
Overture Maps
AOI-scoped extracts for places, buildings, addresses, transportation, divisions
Google Earth Engine
Satellite imagery, NDVI, land cover, climate — AOI-scoped raster extracts
Planetary Computer
Open geospatial data — Sentinel, Landsat, DEM, land use via STAC API
Google Earth Layers
Geographic visualization layers — indexed for catalog search (view-only)
And more!
Request access to contribute your own connectors.
From One‑Offs to Reuse
Most analysis pipelines break the moment you revisit them. This toolkit is opinionated about a few things:
From brittle one-offs to a reusable toolkit
# Before: the typical one-off analysis

# ~/Desktop/econ_study/
#   analysis.ipynb
#   analysis_v2.ipynb
#   analysis_final.ipynb
#   scratch.py
#   scratch_v3.py
#   helpers.py
#   data.csv
#   data_clean.csv
#   data_clean_v2.csv
#   wb_dump.json
#   plot.png
#   plot2.png
#   notes.md
#   requirements.txt

# ad-hoc imports
import requests
import pandas as pd


# inline API logic
resp = requests.get("<some-api-url>")
data = pd.DataFrame(resp.json())


# hard-coded transforms
data = data[data["year"] >= 2000]
data["value"] = data["value"] / 1000


# quick plot
plot(data)
# After: how this repository is structured
# Remember, you just have to chat with AI who writes this too
# data_sources/
#   world_bank/
#   oecd/
#   earth_engine/
#
# pipelines/
#   pull.py
#   normalize.py
#
# outputs/
#   datasets/
#   metadata/
#
# dashboards/

# pull data through a defined source wrapper
raw = fetch(
  "world_bank",
  indicators=[...],
  countries=[...]
)


# normalize into a shared structure
normalized = normalize(raw)


# persist with metadata
save_dataset(
  normalized,
  name="economic_indicators",
  sources=["world_bank"],
  description="GDP, inflation, and employment"
)
Same curiosity. A workflow that finally keeps up.
Run your first analysis in minutes.
No API keys for the toolkit itself. Just a repository you own and a sandbox you control.
Get access & install
git clone
Download datasets
uv run python scripts/setup_datasets.py --datasets worldbank,oecd
Run analysis & export
Chat with your AI in your IDE to pull more data, analyse, and dashboard.
Open dashboard
Follow instructions from your AI to run the dashboard or let the AI do it for you and spin up the dashboard
What gets generated
Interested in collaborating or contributing?
We're looking for research partners, data providers, and sponsors. Drop us a line.